Debugger From Scratch. Part 1. Debugging our way around
How do debuggers work, and how do I make mine?
Debuggers
In world of software engineering and reverse engineering, there definitely is no shortage of debuggers. IDA, WinDbg, x64dbg, gdb, lldb… just to name a few. But how do they work, and especially, how do we make ours?
Basics of a Debugger
A debugger in its very basic form, provides a few commands:
- Breakpoint: Stops execution when this instruction is hit.
- Watchpoint: Watches a region of memory for access/change/execution.
- Memory Read/Write: Self explanatory
- Break: Stop the running program
- Go: Continue the running program.
Windows itself provides us functions to make our own debugger relatively easily. Like DebugBreak, WaitForDebugEvent, DebugActiveProcess and so on. But remind that it doesn’t provide a DebugSetBreakpoint or DebugSetWatchpoint. So in this series, we will be looking forward to making our own debugger, without relying on these APIs.
Learning how to make your own debugger will give you better insight on heisenbugs, how debugging works and how it actually affects your program’s state. This will be an invasive, in-process debugger. So we are in the same context as debugged process. So let’s begin.
Techniques for Debugging
There exists a LOT of ways to debug an application or a kernel. Whether it be through a hypervisor, through external software, or through software itself. Which is used by malware.
In this series we will make an in-process debugger as an example. We will catch our own exceptions, we will set our own breakpoints. Remember that you can do all of those externally too. You just have to make a communication line between exception handler and actual debugger.
How do debuggers work?
Breakpoints
Breakpoint is an instruction that replaces the original code. The most notorious example is int3, which triggers a #BP that informs the OS that this program hit a breakpoint. If there is no active debugger, its counted as an exception and program terminates. But if there is a debugger, or at least, an exception handler, then the handler or debugger will be notified.
In a previous blog of mine we used vectored exception handling to catch our own rsm breakpoint. The logic is same, to debug an application, we will inject a DLL that sets up a VEH to catch EXCEPTION_BREAKPOINT (or in our case, EXCEPTION_ILLEGAL_INSTRUCTION) and inform the “server”.
But as we said, breakpoint replaces existing code. If you ever placed a breakpoint in any debugger, you would see that there is no int3 instruction that is being placed.
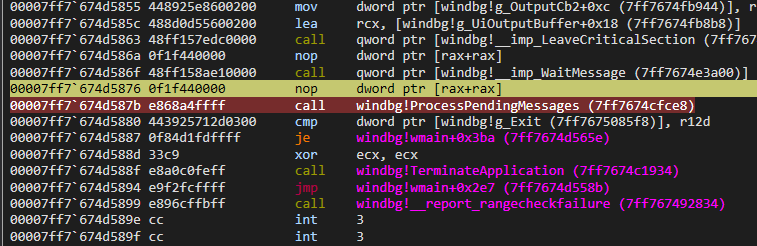
But say, if we used System Informer or Cheat Engine to read that exact memory, we would see an int3 instead of a call.
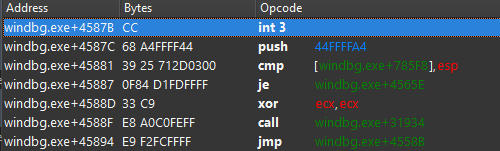
The debugger itself hides the fact that this instruction is no longer that instruction. So our debugger must save the original instruction in memory, and replace it on-the-fly after breakpoint is hit, and re-place it after the next instruction.
There are ways to do debugging without being invasive like this. An example would be using DR registers. Which Cheat Engine itself uses by default. (and can be used with ba in WinDbg too). But they are limited, even though they are stealthier since user-mode applications cannot touch these registers.
Watchpoints
This one is more tricky because how would we know that an application writes to memory? Via utilizing pages.
The general consensus is to use DR registers here. Since they already provide a way to throw #BP when a memory access occurs. But it is limited to 1, 2, 4 or 8 bytes of space. Nevertheless, its most convenient. They are limited to 4, even though they are stealthier as aforementioned.
But in this series, we will be utilizing pages.
Guard Pages
Guard pages are known by their protection flag PAGE_GUARD. Unlike setting the page to PAGE_NOACCESS, the guard page flag preserves the old protection. The guard page acts as an one short alarm. That is, after triggering a STATUS_GUARD_PAGE_VIOLATION, the guard page flag is cleared and page can be used as is.
After our brief coverage of guard pages, now we can focus on how to weaponize that for a watchpoint.
We simply page-align our desired access, and use VirtualProtect to set it PAGE_GUARD. In our exception handler, the ExceptionInformation[0] is:
- 0 if read,
- 1 if write,
- 8 if execute (instruction fetch)
And the ExceptionInformation[1] defines the address that have been accessed.
Remember that setting a page to PAGE_GUARD means that we are watching the entire 4096 bytes of space, so we have to make sure our watchpoints’ addresses with ExceptionInformation[1];
Bonus: This is fundamentally how the !epthook command in HyperDbg operates. Which is described in more detail below. It uses Extended Page Tables (EPT). The hypervisor sets an EPT entry as “invalid”. When the guest OS attempts to access that memory, it triggers an EPT Violation VMEXIT. The hypervisor then temporarily marks the page as valid for the next instruction, sets the Monitor Trap Flag, and lets it execute exactly one instruction before another VMEXIT (just like normal trap flag, described below). It is the same state-machine logic.
But wait, after breakpoints and watchpoints, and our invasion, how do we set breakpoint back after one instruction? Or the PAGE_GUARD?
Single stepping
Single stepping in x86 is achieved using EFLAGS.TF (Trap Flag). When this flag is set, the CPU throws a #DB that we can catch in our exception handler via EXCEPTION_SINGLE_STEP.
We can use GetThreadContext and SetThreadContext to set the trap flag.
So our breakpoint loop will be like this:
- Set breakpoint.
- Breakpoint gets hit.
- Enable trap flag.
- Replace breakpoint with original bytes.
- Continue.
- Next hit.
- Re-write breakpoint.
The same applies to watchpoints as well.
- Set watchpoint.
- Watchpoint gets hit.
PAGE_GUARDis automatically removed by OS.- Enable trap flag.
- Continue.
- EXCEPTION_SINGLE_STEP hit.
- Re-protect the page.
- Continue.
So far our handler will look like this:
1
2
3
4
5
6
7
8
9
10
11
12
13
14
15
16
17
18
19
20
21
22
23
24
25
26
27
28
29
30
31
32
33
34
35
36
37
38
39
40
41
42
43
44
45
46
47
48
// jmp rcx
VOID absolutejmp(UINT64 addr);

LONG Handler(EXCEPTION_POINTERS* ptrs) {
	// trap flag is disabled upon exception handling. re-enable
	ptrs->ContextRecord->EFlags |= 1 << 8;

	if (ptrs->ExceptionRecord->ExceptionCode == STATUS_GUARD_PAGE_VIOLATION) {
		DWORD old = 0;
		// page align as well.
		UINT64 accessType = ptrs->ExceptionRecord->ExceptionInformation[0];;
		VirtualProtect(ptrs->ExceptionRecord->ExceptionInformation[1] & ~(0xFFF), 1024, PAGE_GUARD | PAGE_READWRITE, &old)
	}
	else if (ptrs->ExceptionRecord->ExceptionCode == EXCEPTION_BREAKPOINT) {
		// move it back, so we don't execute half-instruction
		ContextRecord->Rip -= 1;
		*(PBYTE)(ContextRecord->Rip) = /*whatever it was*/;
	}
	else if (ptrs->ExceptionRecord->ExceptionCode == EXCEPTION_SINGLE_STEP) {
		// set the breakpoint back. since #BP and #DB are traps, the instruction pointer moves.
		*(PBYTE)(ContextRecord->Rip - 1) = 0xcc // int3
	}

	// go!
	return EXCEPTION_CONTINUE_EXECUTION;
}

int main() {
	AddVectoredExceptionHandler(0, Handler);

	PBYTE alloc = (PBYTE)VirtualAlloc(NULL, 1024, MEM_COMMIT | MEM_RESERVE, PAGE_READWRITE | PAGE_GUARD);

	absolutejmp(alloc);	// STATUS_GUARD_PAGE_VIOLATION, 8
	BYTE me = *alloc;	// STATUS_GUARD_PAGE_VIOLATION, 0
	*alloc = 0;		// STATUS_GUARD_PAGE_VIOLATION, 1

	CONTEXT ctx;
	ctx.ContextFlags = CONTEXT_AMD64 | CONTEXT_FULL;
	GetThreadContext(GetCurrentThread(), &ctx);

	ctx.EFlags |= 1 << 8;

	SetThreadContext(GetCurrentThread(), &ctx);	// A lot of EXCECPTION_SINGLE_STEPs

	alloc = 0;		// EXCECPTION_SINGLE_STEP

	return 0;		// EXCECPTION_SINGLE_STEP as well
}
Thanks for reading!